
 Sustainability is becoming a guiding principle for today’s buyers. It’s particularly important in the automotive and white goods sectors, where consumers are increasingly willing to pay a premium for environmental credentials. It is also a growing force in architecture, infrastructure and manufacturing industries.
However, it’s a case of ‘buyer beware’. Variations in reporting can make it difficult to compare the carbon footprint of stainless steel from different suppliers.
Sustainability is becoming a guiding principle for today’s buyers. It’s particularly important in the automotive and white goods sectors, where consumers are increasingly willing to pay a premium for environmental credentials. It is also a growing force in architecture, infrastructure and manufacturing industries.
However, it’s a case of ‘buyer beware’. Variations in reporting can make it difficult to compare the carbon footprint of stainless steel from different suppliers.
While two products can appear identical in terms of composition and mechanical dimensions, their carbon footprints can be significantly different. That’s because steel mills often take differing approaches to energy efficiency and procurement of low carbon energy for their processes, as well as using low carbon raw materials.
Another challenge is that carbon reporting varies between suppliers and countries. Not all reporting methods consider carbon dioxide (CO2) emissions from ‘cradle to gate’. So it’s important for buyers to ask for the right data so that they can compare like with like.
We’ve found that some of our competitors produce stainless steel with a carbon footprint that is five times higher. When compared with the global average carbon footprint, our production saves some 8 million tonnes of CO2 annually.
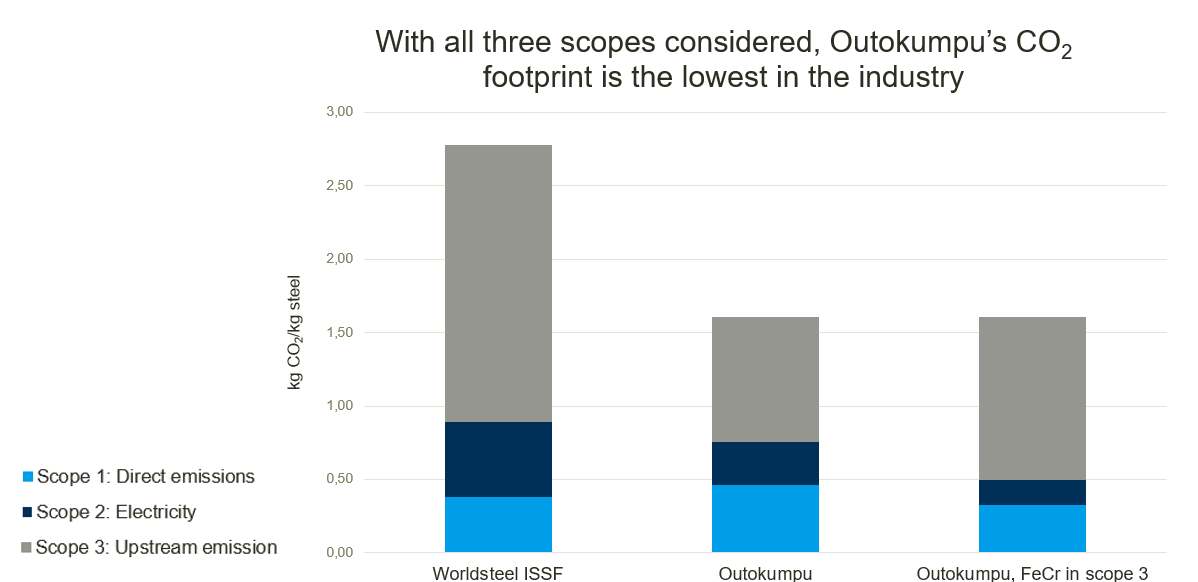
Three scopes to consider
The ISO 14040 environmental management standard help to clarify the situation. It provides a framework to assess the CO2 emissions of products and raw materials. It breaks down their carbon footprint into three scopes.- Scope 1 covers direct emissions from a producer’s own operations. For stainless steel, that could include burning of fossil fuels to heat furnaces.
- Scope 2 covers indirect emissions. These arise from the generation of electricity that we use on our production sites. Outokumpu’s strategy is to minimize our Scope 2 emissions by sourcing electricity from low-carbon generators, for example hydro-electric power.
- Scope 3 covers the emissions that arise from the raw materials from suppliers. For stainless steel, it might cover mining, and production of the ferronickel which is used to make stainless steel, as well as the sourcing and transport of recycled scrap. This is where particular care is needed as not all stainless steel producers provide data under Scope 3.
Of these measures, Scope 3 is the most challenging as it relies on data from the supply chain, whereas Scopes 1 and 2 are relatively straightforward to assess as they are mainly in-house and needed information is more readily available.
The big takeaway is that you can only get a true picture of the carbon footprint of any raw material by combining data from all three scopes. The fact that raw materials, or scope 3 emissions, can account for up to two thirds of the footprint of stainless steel only highlight the importance of knowing what you are comparing.
How the structure of the company influences reporting
One example that shows the importance of getting a full picture on all three scopes is ferrochrome, a raw material that is essential for the production of stainless steel.
At Outokumpu, we produce our own ferrochrome and therefore we include its carbon footprint in our Scope 1 and 2 reporting for example in our annual sustainability reports. However, not all producers have the capability to do this. Some companies buy ferrochrome from third party suppliers. As a result, ferrochrome belongs in their Scope 3 reporting, and thus it is seldom reported in company footprints.
That is important as ferrochrome production is energy intensive. We have worked hard on energy efficiency measures across our production and we also buy low-carbon electricity. As a result, our ferrochrome has less than half the carbon footprint of the global average.
However, since not all suppliers proactively report their Scope 3 data an unwary customer could draw the wrong conclusions when evaluating the carbon footprint of steel from different suppliers. In the longer term, they might even pass on this error by including it in their own Scope 3 carbon footprint.
Recycling of scrap as a key to the lowest carbon footprint
An effective way to minimize our carbon footprint is by sourcing steel scrap as a raw material rather than virgin ore. We base our production on using 85 percent scrap, highest rate in the industry.
According to research by the Fraunhofer Institut, every tonne of austenitic stainless steel scrap we use saves 4.3 tonnes of CO2 emissions.
Our use of recycled scrap material is therefore a major contributor to our status as the world’s leader in sustainable stainless steel, with the lowest carbon footprint.
We have worked hard to develop strong relationships with our scrap metal suppliers. This includes technical requirements of sourcing scrap with the right alloy composition. Better quality scrap of the right composition is key to using recycled steel as efficiently as possible, taking advantage of all the valuable alloying elements that are present in the scrap.
Environmental Product Declarations for transparency
The most reliable sources for data on CO2 emissions are Environmental Product Declarations (EPDs). These are created on the basis of life cycle assessment according to ISO 14040 and must be verified by a third-party auditor.
Carbon footprint data can also be found in materials databases. These are a good guide to the average values for the carbon footprint of many raw materials and are helpful for making high-level estimates. However, being average values, they don’t provide the accurate carbon footprint for any particular supplier.
Therefore, the best way to achieve transparency is EPDs. We published our first EPDs in 2013 and we also formally report on our environmental performance through our Annual Sustainability Review alongside our corporate financial reporting.
Sustainability as a competitive advantage
Interest in sustainability is growing. We’re finding that more of our customers are under pressure from their customers to demonstrate their sustainability credentials. In turn, they are asking for our EPDs to use in their own carbon reporting.
We have also engaging in initiatives like Science Based Targets, a program backed by the UN Global Compact that requires businesses to set ambitious long-term objectives, with milestone targets along the way. We have committed to this initiative and are currently on track to meet our first five-year target to reduce the CO2 emissions of our steel by a fifth by 2023.
However, it’s vital that we combine our advantage in carbon footprint with competitive pricing and reliable supply of the right grades and products to meet our customers’ needs.