
In November 2022, Outokumpu became the world’s first stainless steel producer to provide customers with the carbon footprint of the specific product they’re buying. Markus Buckner, Head of Mobility & Transport at Outokumpu, explains how this major step in transparency and sustainability has been achieved and how it offers a competitive CO2 advantage in the automotive and transportation industries.
Stainless steel is an important material in the supply chain for the automotive industry, as well as buses, coaches and rail vehicles. It is for example used in exhaust systems and engine components for combustion engines, as well as for chassis and trim parts. Stainless steel will also play an important role in future mobility, such as battery housings for electric vehicles and components in hydrogen fuel cells.
When specifying stainless steel, automotive engineers consider our materials alongside other stainless steel suppliers, as well as competing materials such as aluminum and carbon steel. They will select the material with the best overall advantage from a commercial and technical point of view.
However, sustainability is changing the game, for example through the EU’s Fit for 55 package. This means that sustainability is becoming an important buying factor for Tier 1 and 2 suppliers and vehicle OEMs, as well as the bus, coach and train building industries.
Learning to interpret carbon footprint
Anticipating this, we have developed production monitoring and measurement at our European mills over recent years to provide customers with the carbon footprint for the specific grades they’re buying. This data goes down to the specific alloy, production route, product form and batch and cover Scopes 1-3 under the ISO 14047 standard. Our calculation methodology is based on a rolling average and has been independently verified by engineering consultancy WSP.
This step is a major milestone for the industry. Energy input and emissions to produce stainless steel vary depending on alloying content, production route, processing steps and other variables.
It also provides a sustainability advantage for customers that have been relying on industry average figures until now. Stainless steel produced in Europe has an estimated average carbon footprint of 2.8 kg of CO2 per kg. Outokumpu’s average carbon footprint is 1.8 kg of CO2 per kg. However, for the individual grades the carbon footprint could be less than the average, as illustrated in the Figure 1 with cold rolled 304L at 1.4 kg of CO2 per kg. And whereas higher alloy content may lead to a higher carbon footprint for a given product, the benefit is greater certainty when comparing and using stainless steel products for manufacturers that are serious about sustainability.
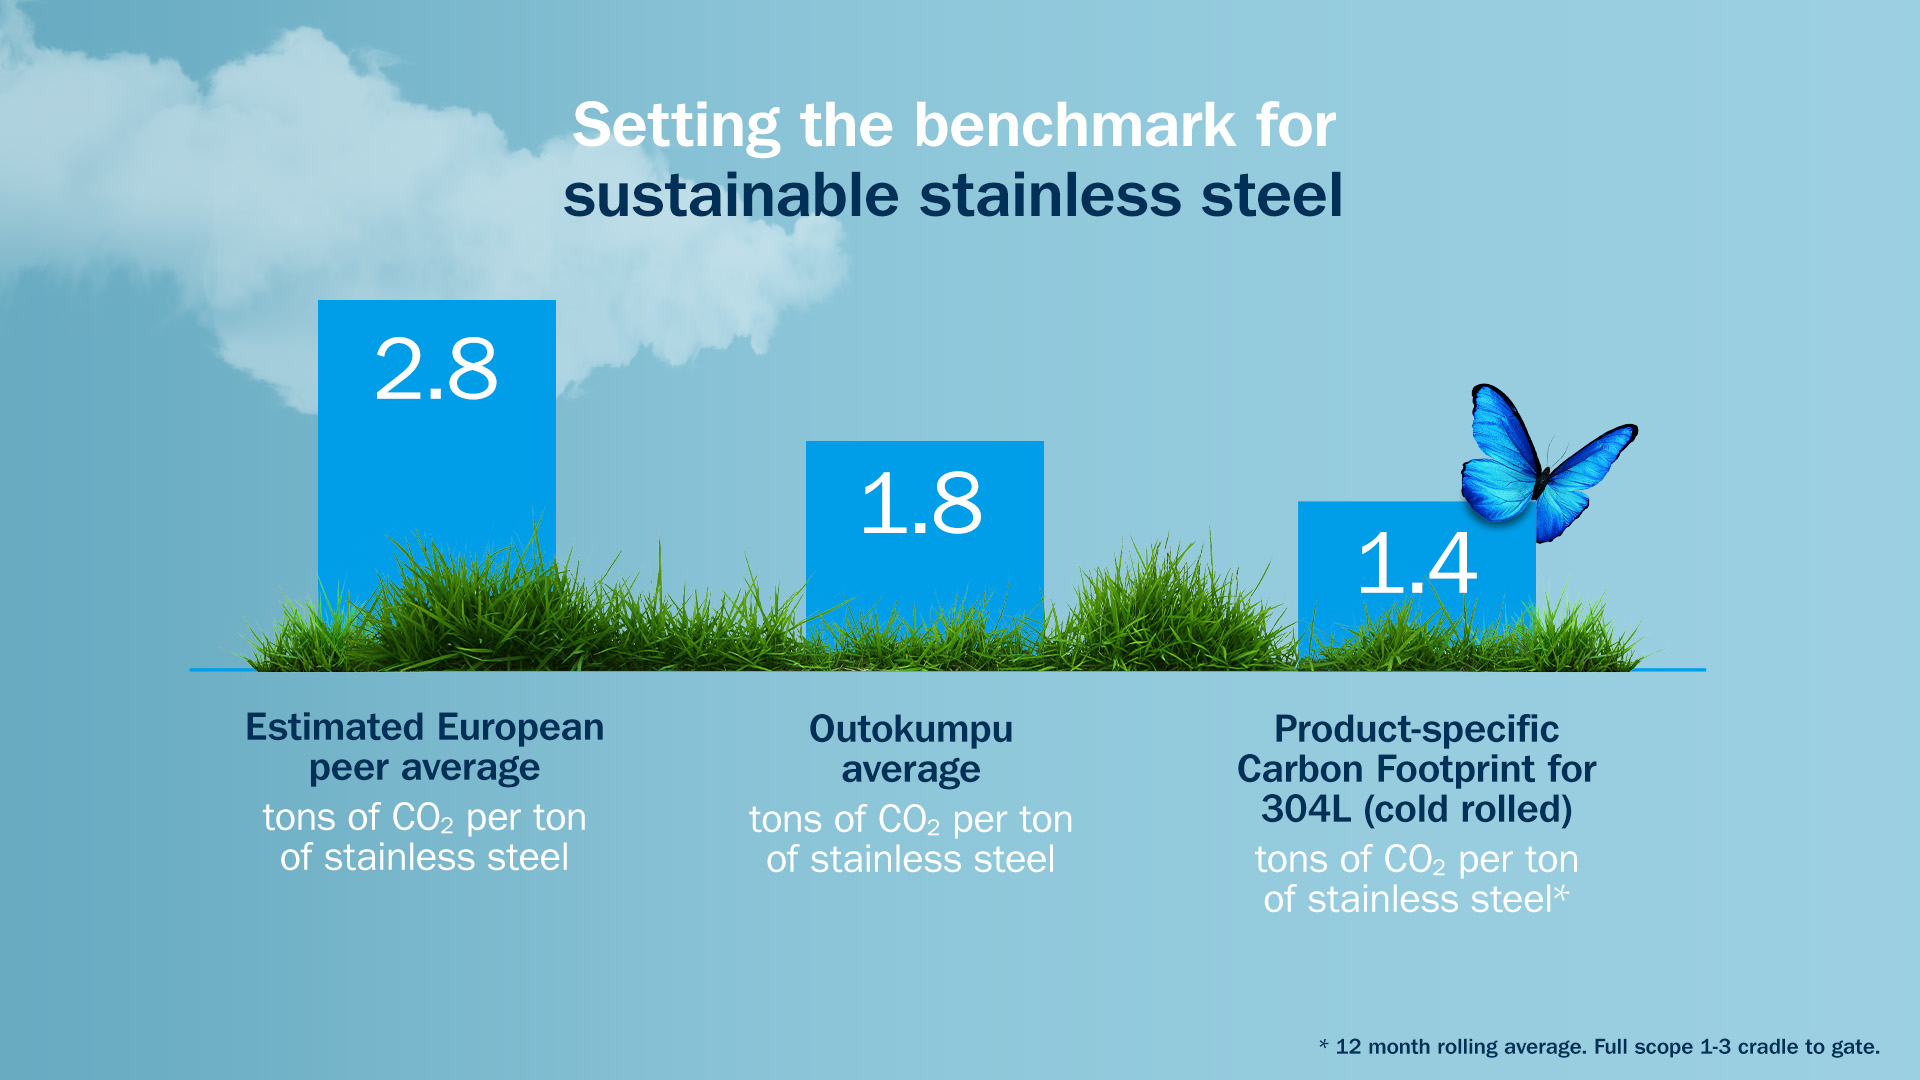
Figure 1. Product-specific carbon footprint help Outokumpu customers to reduce their climate emissions.
Scope 3 emissions representing the embedded carbon dioxide in raw materials are often the biggest share of the carbon footprint. Therefore, by using Outokumpu as a preferred supplier, customers can use our product-specific data to calculate a more accurate carbon footprint for their own products.
Sustainability and transparency
From this November, our customers will find the carbon footprint of their stainless steel on their product certificates alongside other properties such as yield strength, tensile strength and elongation, which are universally recognized as mechanical properties.
This raises an interesting point that data presented as fact may be more variable than it seems. For example, engineers around the world use different methods to calculate tensile strength – and as a result, the figures quoted can be significantly different in different markets.
Similarly, there is variation in carbon footprint calculations. For example, suppliers might have used the ISO 14040 methodology but applied product category rules (PCR) in a different way. Alternatively, they might underestimate their footprint by using ‘average’ values under scope 3 to overlook issues in the supply chain.
Another way to enhance apparent carbon footprint is by including carbon offsets in published data, which could be seen as greenwashing.
We’re also seeing a new trend that is taking carbon footprint into uncharted territory by including end of life emissions. This is especially true for carbon steel. While laudable, this does not help buyers compare products on a like-for-like basis and is not fully transparent. Without knowing the basis of the calculation, it’s impossible to know whether including end of life is a good measure or whether it understates carbon footprint.
Over the long term, we expect that the industry will evolve to follow the same standardized process, like it has for tensile strength. Until then, buyers should be ready to ask hard questions about how carbon footprint figures have been calculated. They may even need to apply the PCRs consistently in their own calculation. This will enable them to compare products on an equal basis and provide their own customers with accurate sustainability data.
We’re taking the approach that the most transparent and straightforward way to calculate carbon footprint with the ISO 14040 and ISO 14047 standards is to gather and measure accurate data across Scopes 1, 2 and 3 and avoid using any offsets. It is an open book approach that enables our customers to use our data with confidence.
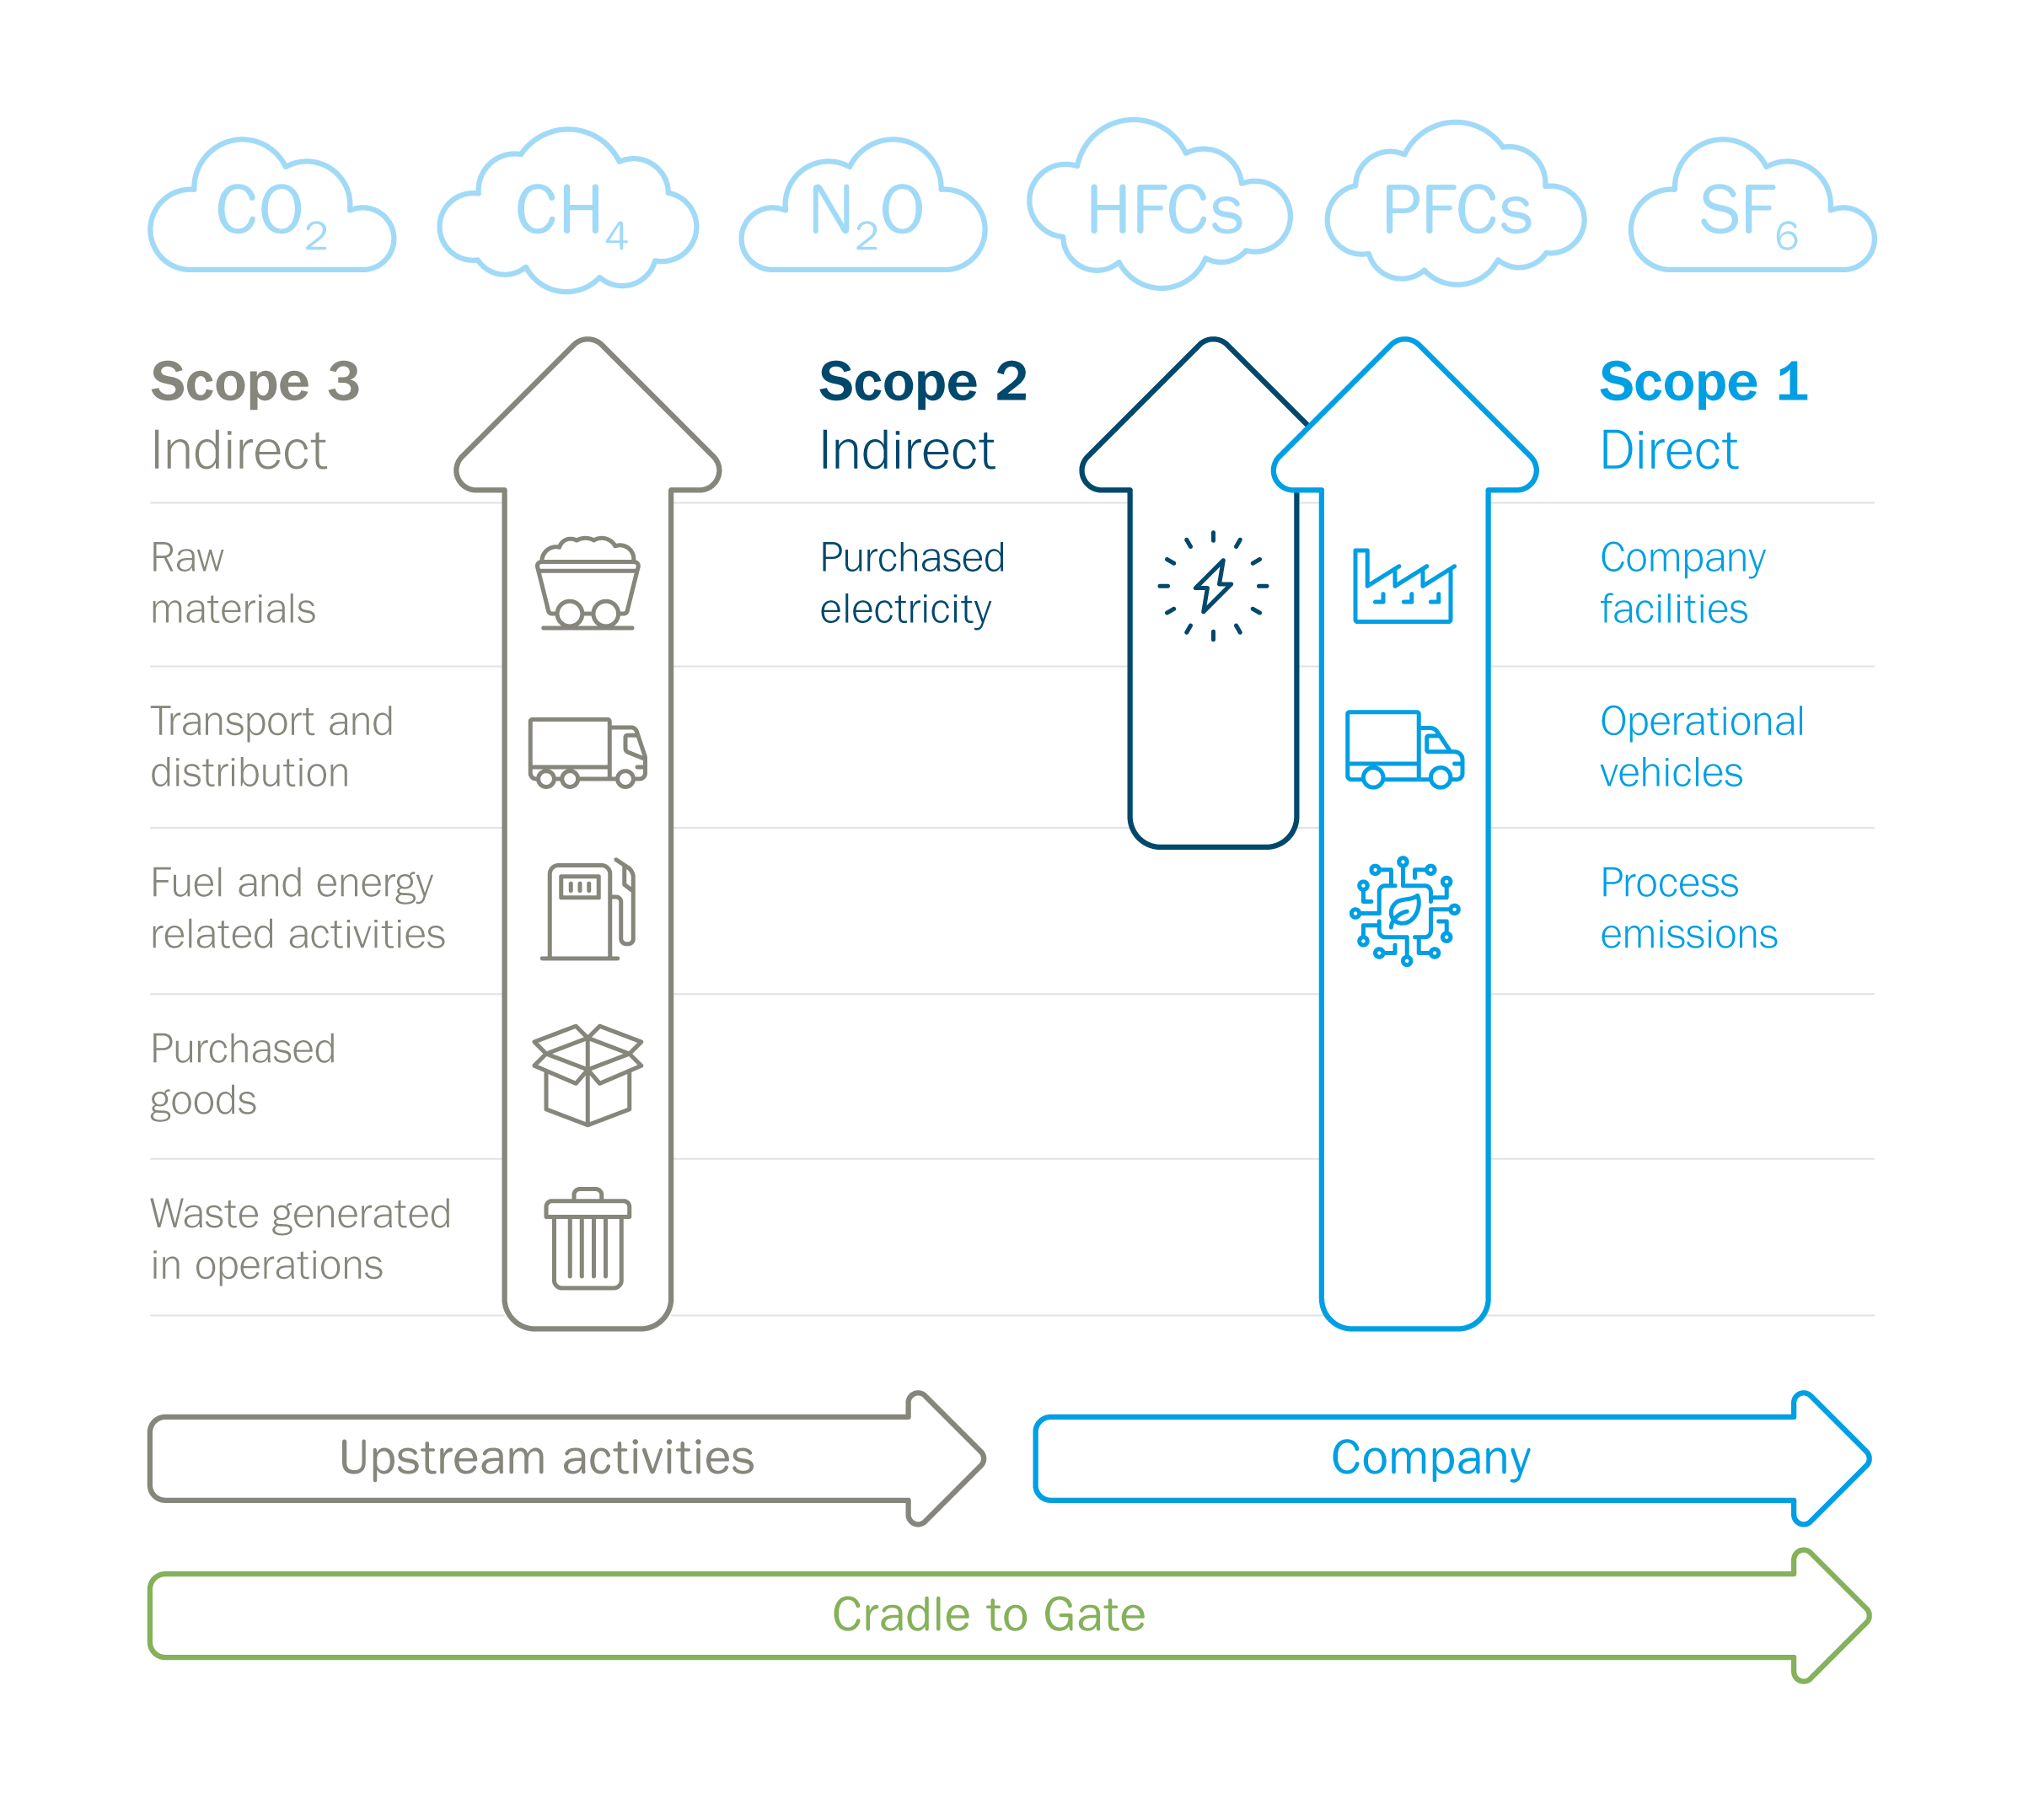
Figure 2. Outokumpu considers all Green House Gas (GHG) emissions through the whole production chain (Scope 1, 2, 3) and follows the Cradle to Gate approach.
The sustainability advantage of engineering design
Another aspect of sustainability where stainless steel can create an advantage is vehicle design. Specifying a high-strength material can reduce the amount of material needed for a component or subsystem. For example, by using austenitic stainless steel instead of carbon steel tubing to build bus and coach frames, it’s possible to use less material.
As a result, it may be possible to save 1,000 kg of raw material on a typical bus, which cuts its carbon footprint, as well as its weight. Not only does this save energy over every kilometer it travels during its lifetime but the lower weight also enables downsizing of other components such as chassis and bearings.
First in the industry
The new product-specific approach is the latest step forward in our goal to reduce our CO2 emissions by 42% by 2030. It also highlights how we are the only stainless steel producer with a climate target approved by the Science-Based Targets Initiative under 1.5° climate target.
As the first stainless steel producer to provide product-specific carbon footprint data, customers can use our new approach to achieve a competitive advantage. OEMs and Tier 1 and 2 suppliers can re-evaluate their own carbon footprint and publish more accurate data for their components with greater confidence.
Stainless steel for automotive & transportation
Learn more about our stainless steels for the automotive and transportation industries by clicking the link below.