
What is duplex stainless steel – and why are the phase fractions important?
Duplex stainless steel grades have a ferritic-austenitic microstructure, with a phase balance of approximately 50% ferrite and 50% austenite. They combine many of the beneficial properties of ferritic and austenitic stainless steels.
The duplex microstructure contributes to the high mechanical strength and high resistance to stress corrosion cracking. Knowing the fraction of each phase present in the steel is vital in establishing that the material will have the desired properties.
The main methods
There are three main methods for determining the phase fraction in a duplex stainless steel:
- Manual Point Counting (MPC) to ASTM E562 – this is widely used and often required
- Image Analysis (IA) to ASTM E1245 – generally the better option
- Magnetic methods – can be easy to use but subject to many influencing factors
Manual Point Counting (MPC)
With the manual point counting (MPC) method a point grid of between 16 to 400 points is distributed on the microstructure of examined sample as shown in Figure 1. The number of hits measured in each phase is then recorded. To get good statistics this method is normally time-consuming but is a good choice for even size phase distributions i.e. good for base material but not weldments and secondary austenite). It does though offer little or no information on overall distributions (surface to surface variations) and it is subjective. It should be emphasized that using an active decision for setting value of grid point improves the accuracy for this method. Using semi- automatic tools also makes this method faster.
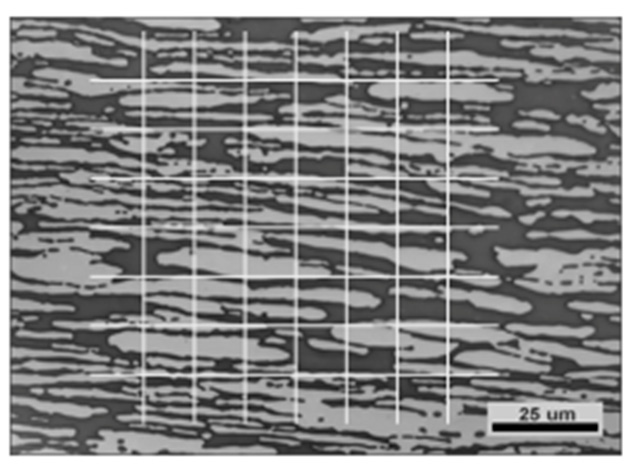
Image analysis (IA)
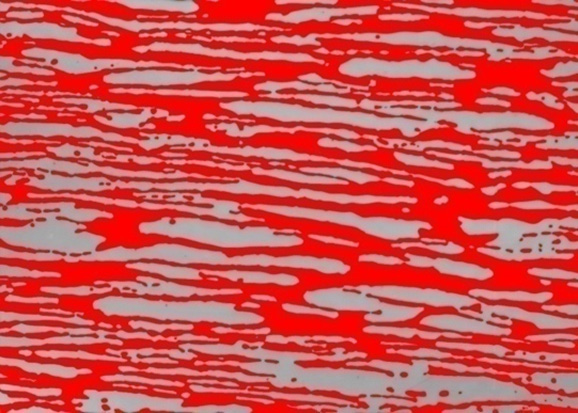
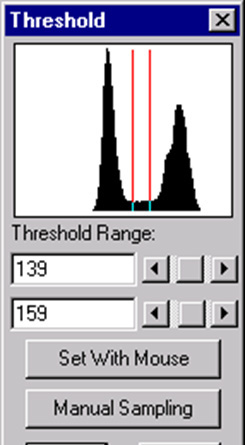
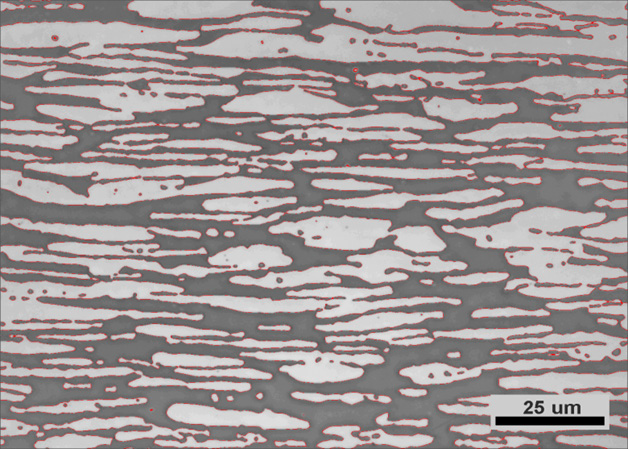
Image analysis uses computer software to analyse the microstructure on a pixel basis– see Figure 2. One can use either a manual or automatic set threshold and the method has the benefit of being fast. It is a good choice for most distributions and provides information on the overall distribution. Unlike MPC, IA is objective rather than subjective. But its success does rely on the quality of the etching.
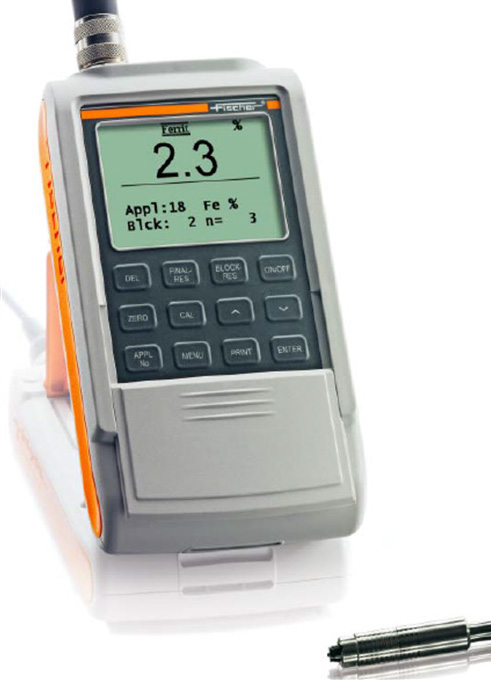
Magnetic method – Ferrite scope
The Ferrite scope – see Figure 3 - uses magnetic permeability, rather than saturation magnetism, to determine the volume analysis of the ferrite content. It is a very fast method using a hand-held probe. It may provide information on overall distributions but is difficult to apply for very small volumes. It needs good calibration and can then provide objective information.
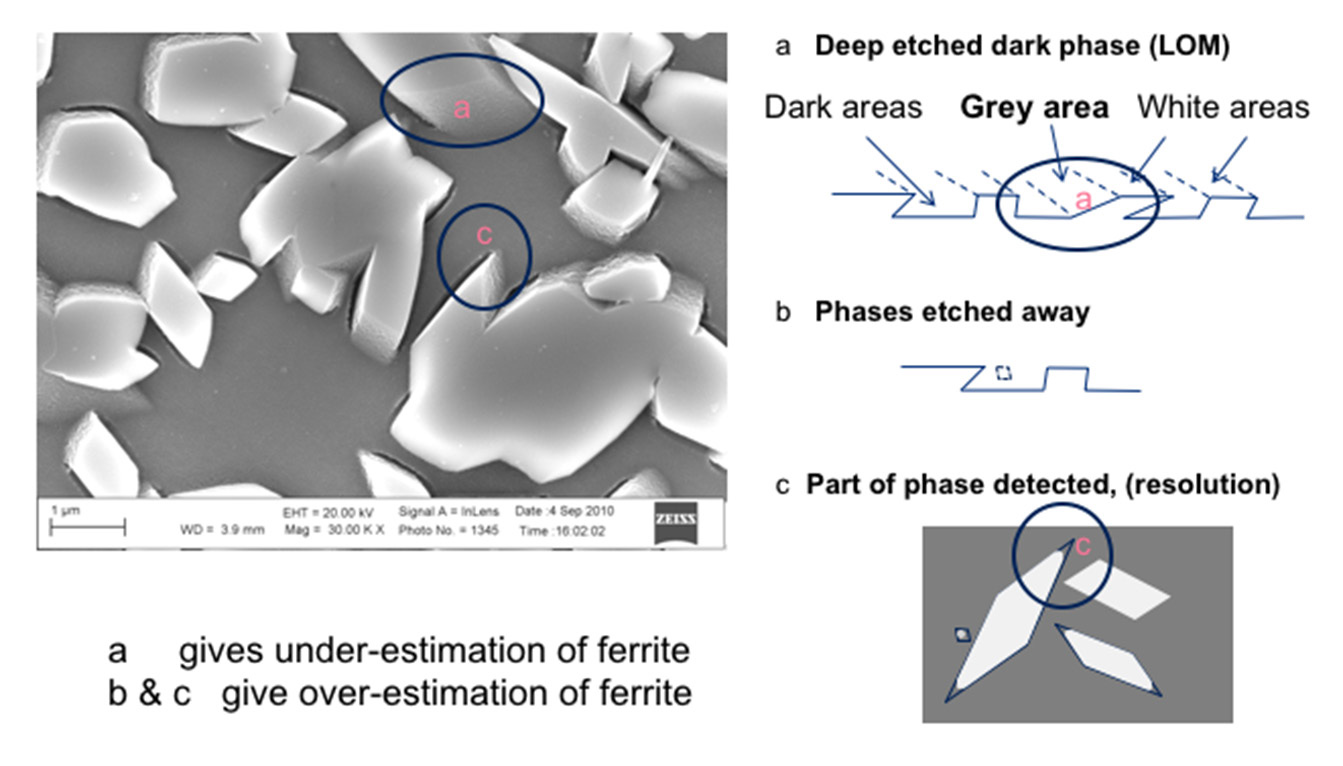
Issues with deep etching
Deep etching of a sample can cause issues that result in either over- or under-estimation of the ferrite phase as illustrated in Figure 4.
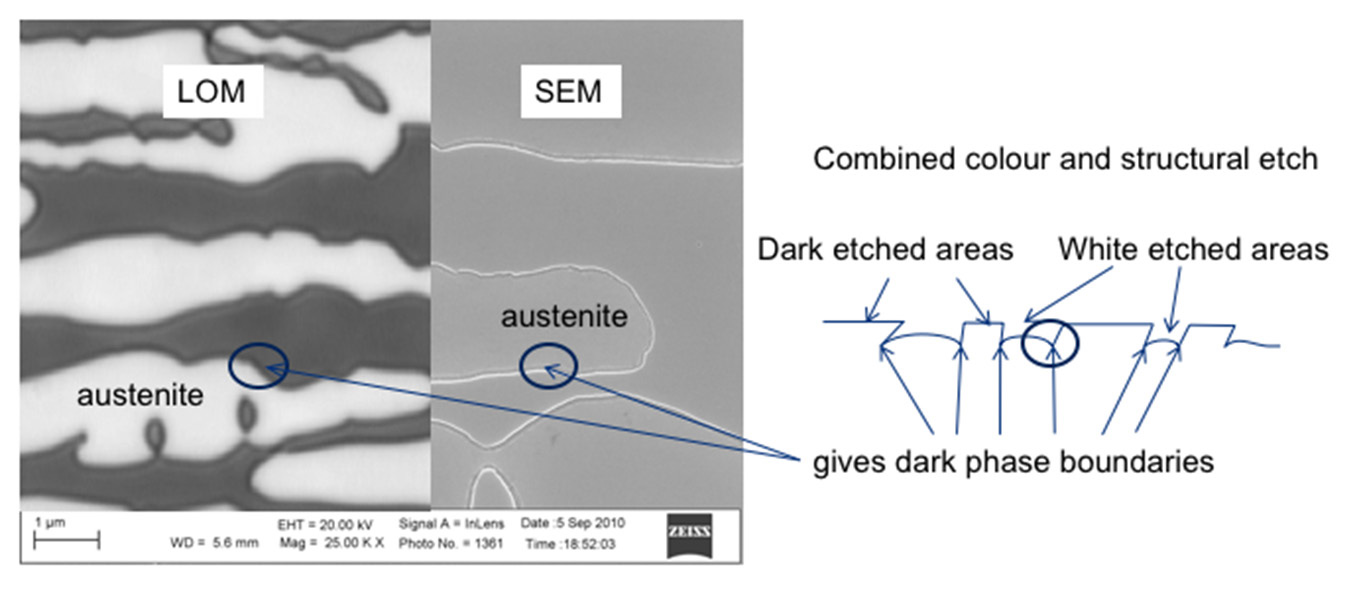
Etching of white phase
Etching of the white phase in LOM (light optical microscopy) may give an over-estimation of the dark phase (ferrite in the example shown in Figure 5) if pronounced.
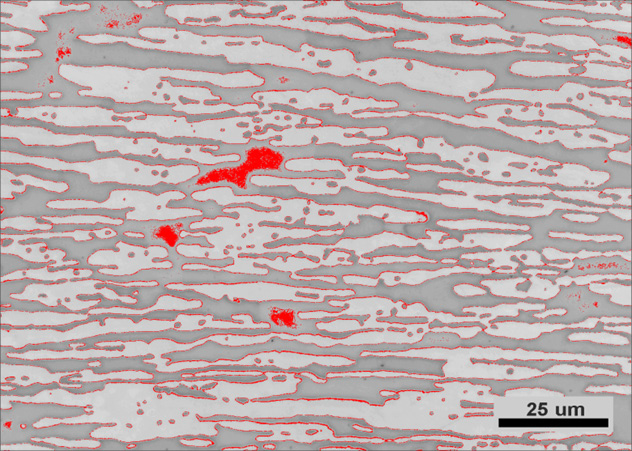
The effect of contrast in etching for IA
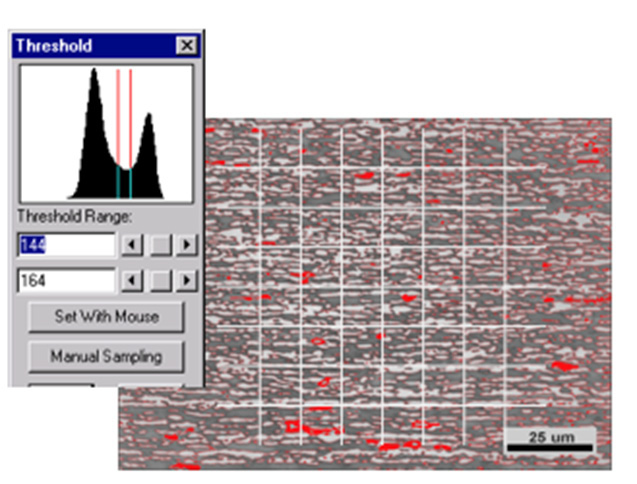
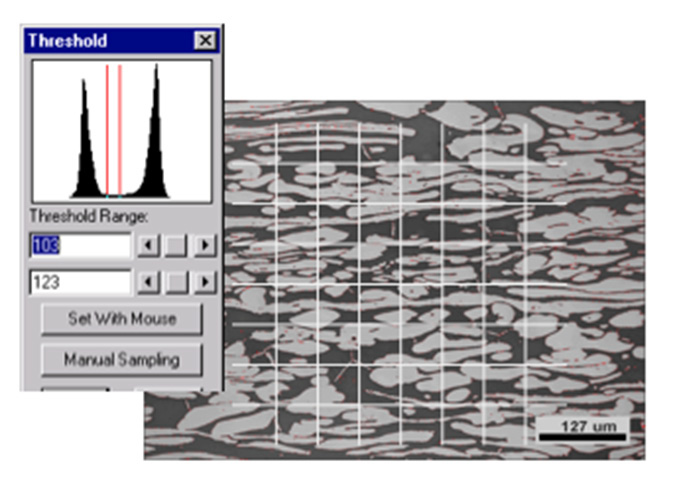
To have enough contrast between ferrite and austenite is very important for obtaining adequate results with IA. In Figure 6 an image with narrow contrast is shown and where it can be seen that “phase boundary”(6%) also wrongly include parts of the ferritic area. In Figure 7 on the other hand, with high contrast, a phase boundary area of 4% is detected and no obvious faults in the threshold can be seen.

Phase boundary area effects in IA and MPC
As shown in Figures 8 and 9, there can be phase boundary area effects in both IA and MPC. In Figure 8 the low contrast show phase boundary to be obviously wrong (not only boundaries) and for MPC the decision for setting phase will be tougher as more boundaries exist in each image. In Figure 9 the opposite situation exists with the very high contrast gives perfect thresholding for IA as well as the decision in MPC becomes easier with less boundaries in the image field.
Comparison of EBSD and IA
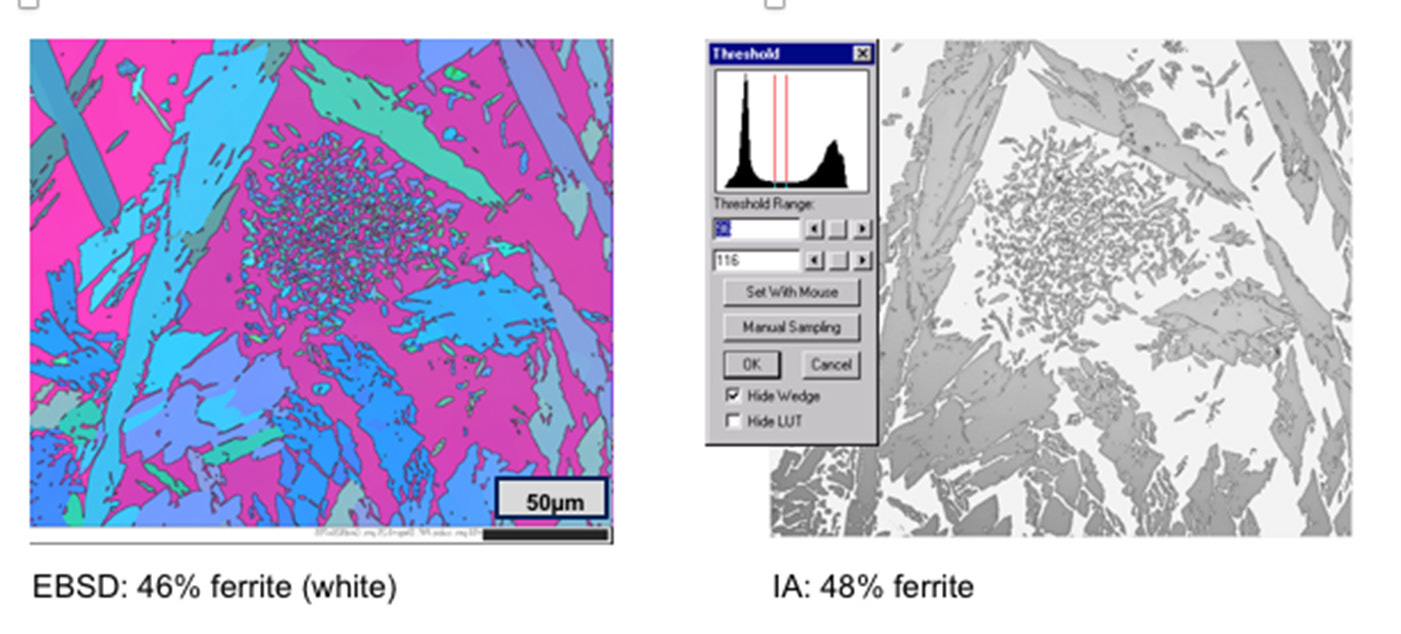
EBSD (electron backscatter diffraction) in an SEM (scanning electron microscope) is a useful reference technique for phase fraction measurement. One example is shown in Figure 10 where IA only over-estimates the ferrite content by 2% in a relatively tough structure with different structure sizes.
Comparison of EBSD and IA at high magnification
At higher magnification the over-estimation of the ferrite content by IA becomes more pronounced. In the case shown in Figure 11, EBSD indicates a ferrite content of 51% and IA 56%.

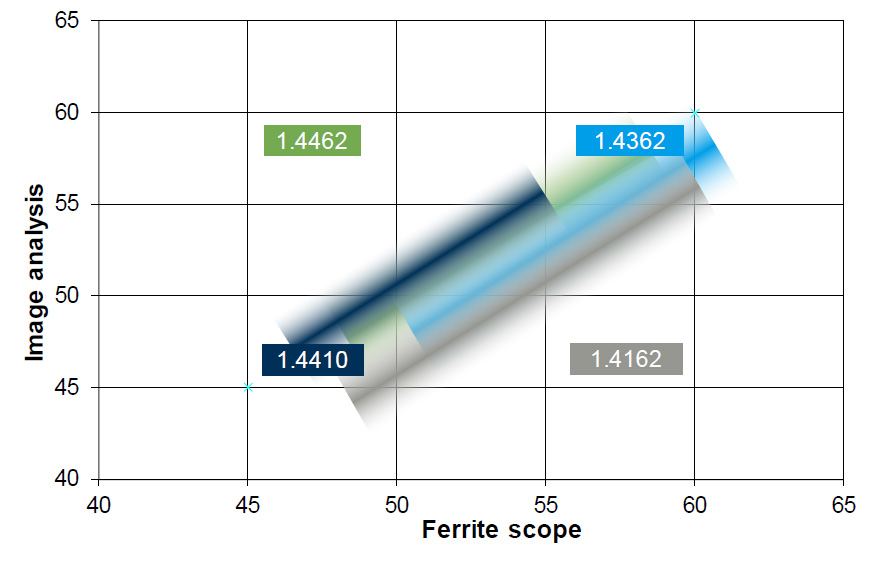
Comparison of IA and the Ferrite scope
Figure 12 shows a comparison, for different materials, of the ferrite content measured by IA and Ferrite scope. In some cases the Ferrite scope produces an under-estimate, in others it over-estimates. Optimally it has been shown that a ferrite scope needs to be calibrated for alloy and product.
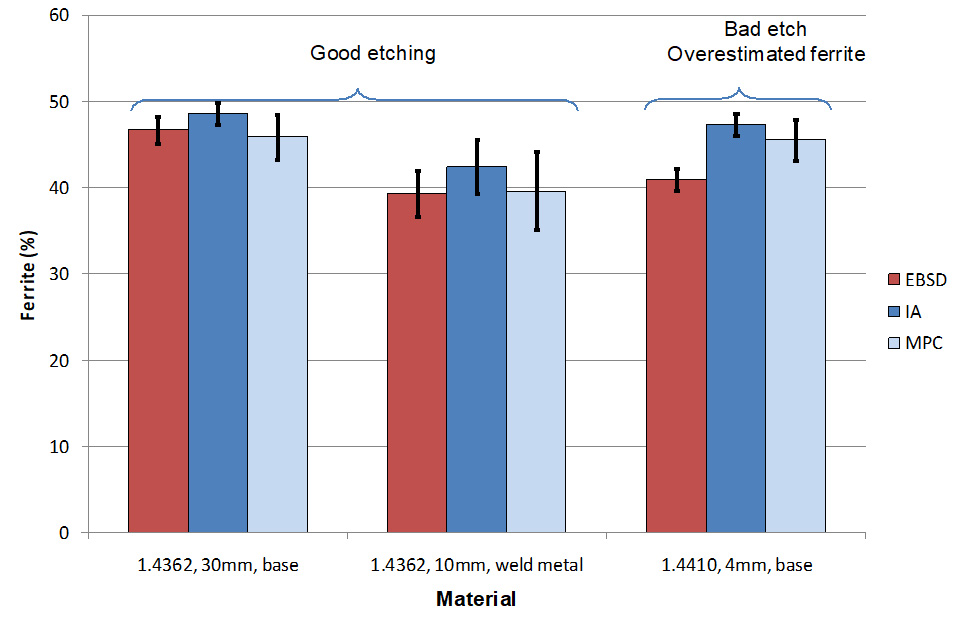
Comparison of IA, MPC and EBSD
Figure 13 shows that there is generally a reasonable correlation between the results of EBSD, IA and MPC for good etching. However, bad etching will result in both IA and MPC over-estimating the ferrite content.
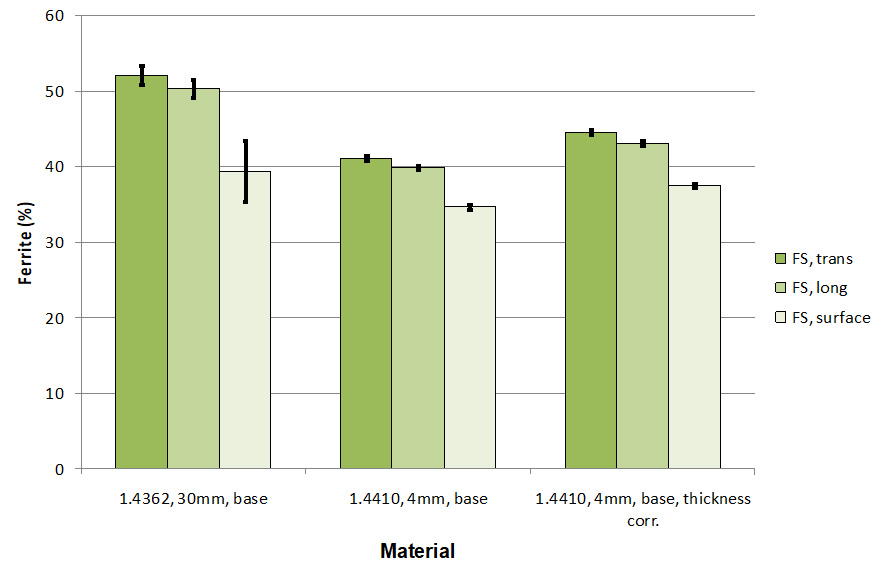
Different types of measured sections and thickness correction for the Ferrite scope
In Figure 14 we see the significant variation in the reading produced by the Ferrite scope depending on the type of cross-section that is measured. While the second and third group of bar graphs show how the reading can be corrected for thickness.